Software
“Debugging is twice as hard as writing the code in the first place. Therefore, if you write the code as cleverly as possible, you are, by definition, not smart enough to debug it.” – Brian Kernighan
All of the projects presented here were completed by me or in a team for academic and self-learning purposes.
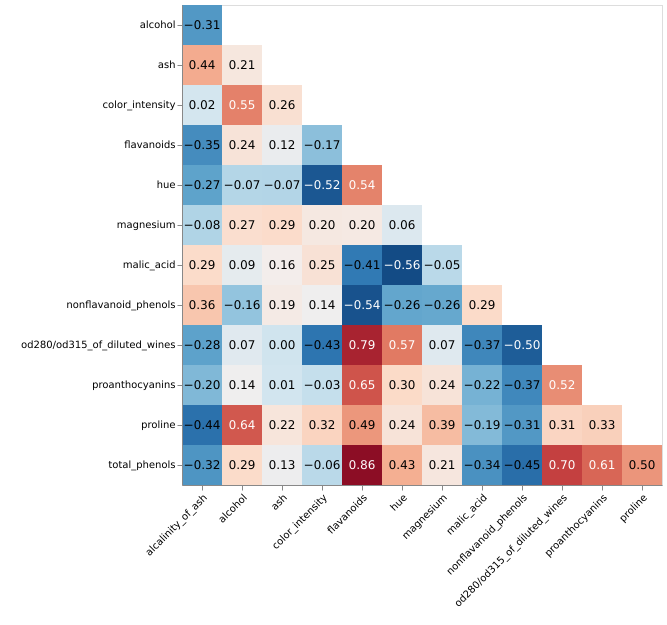
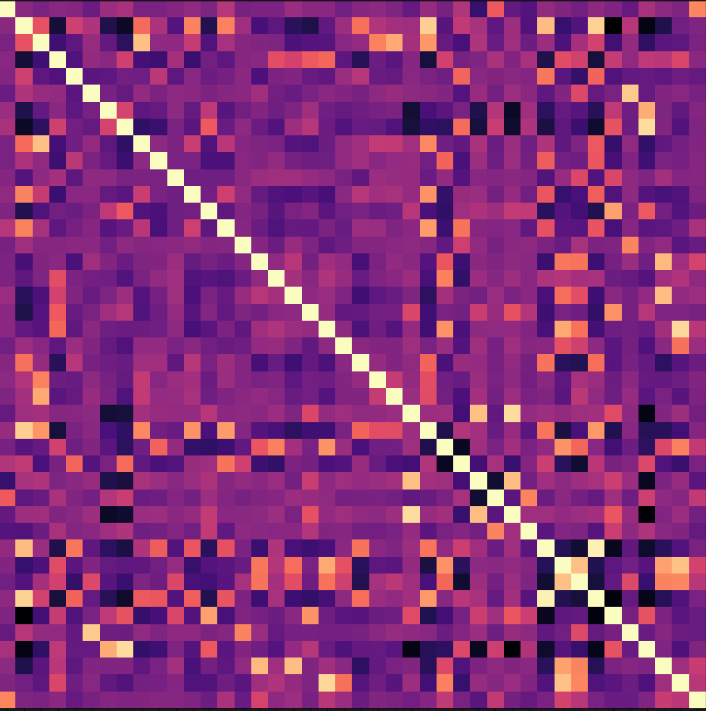
iCAN is an open-source command-line interface (CLI) tool that represents an extension of the CMANGOES CLI tool. iCAN enhances the algorithm for encoding organic molecules, allowing for a greater amount of information to be encoded in numerical or image formats. Additionally, it empowers users to interpret these encodings. The innovative interpretability feature enables users to readily identify patterns and detect recurring signals within the encoded data. GitHub repository.
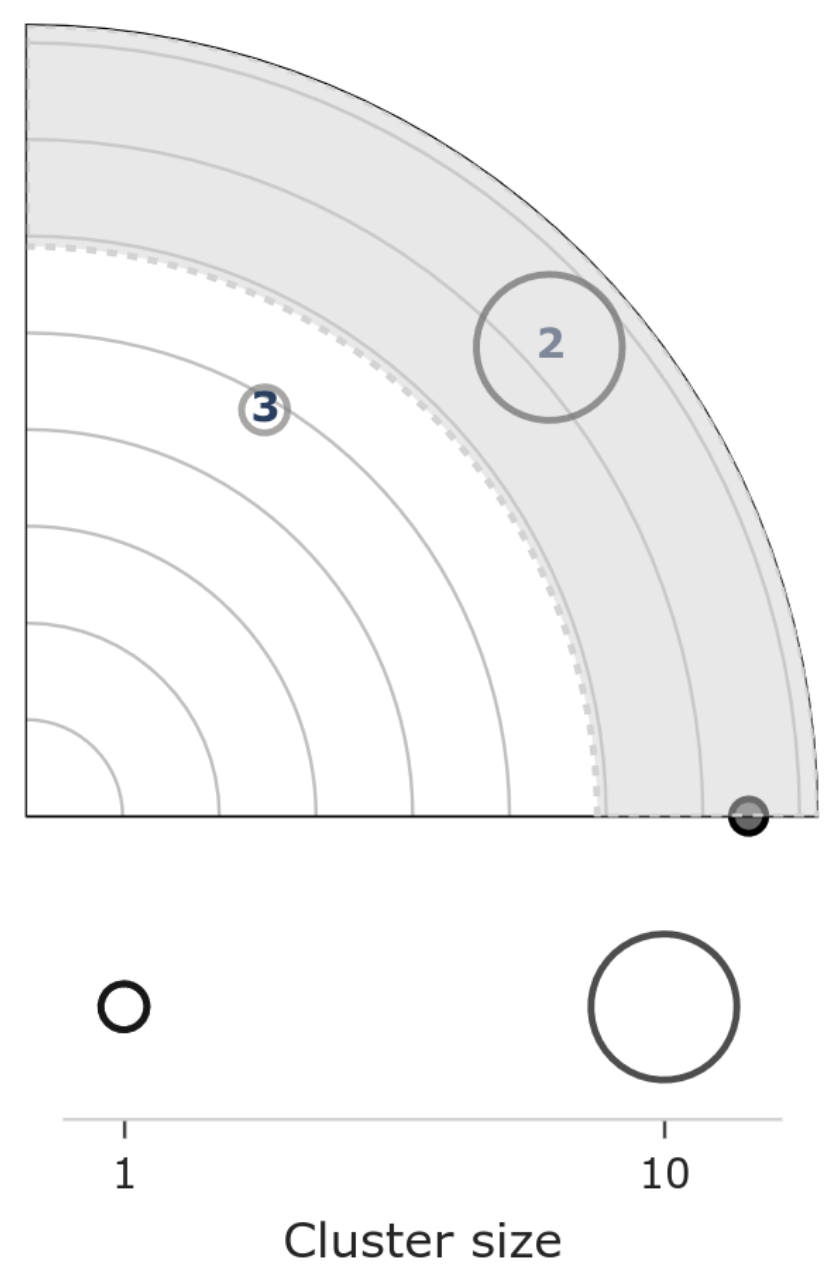
polar-diagrams-dashboard is an open-source dashboard that leverages the polar-diagrams library and Plotly Dash to incorporate additional visualization techniques into the current solution. It implements the overview+detail and small-multiple visualization techniques to fully harness the capabilities of the polar-diagrams library. GitHub repository.
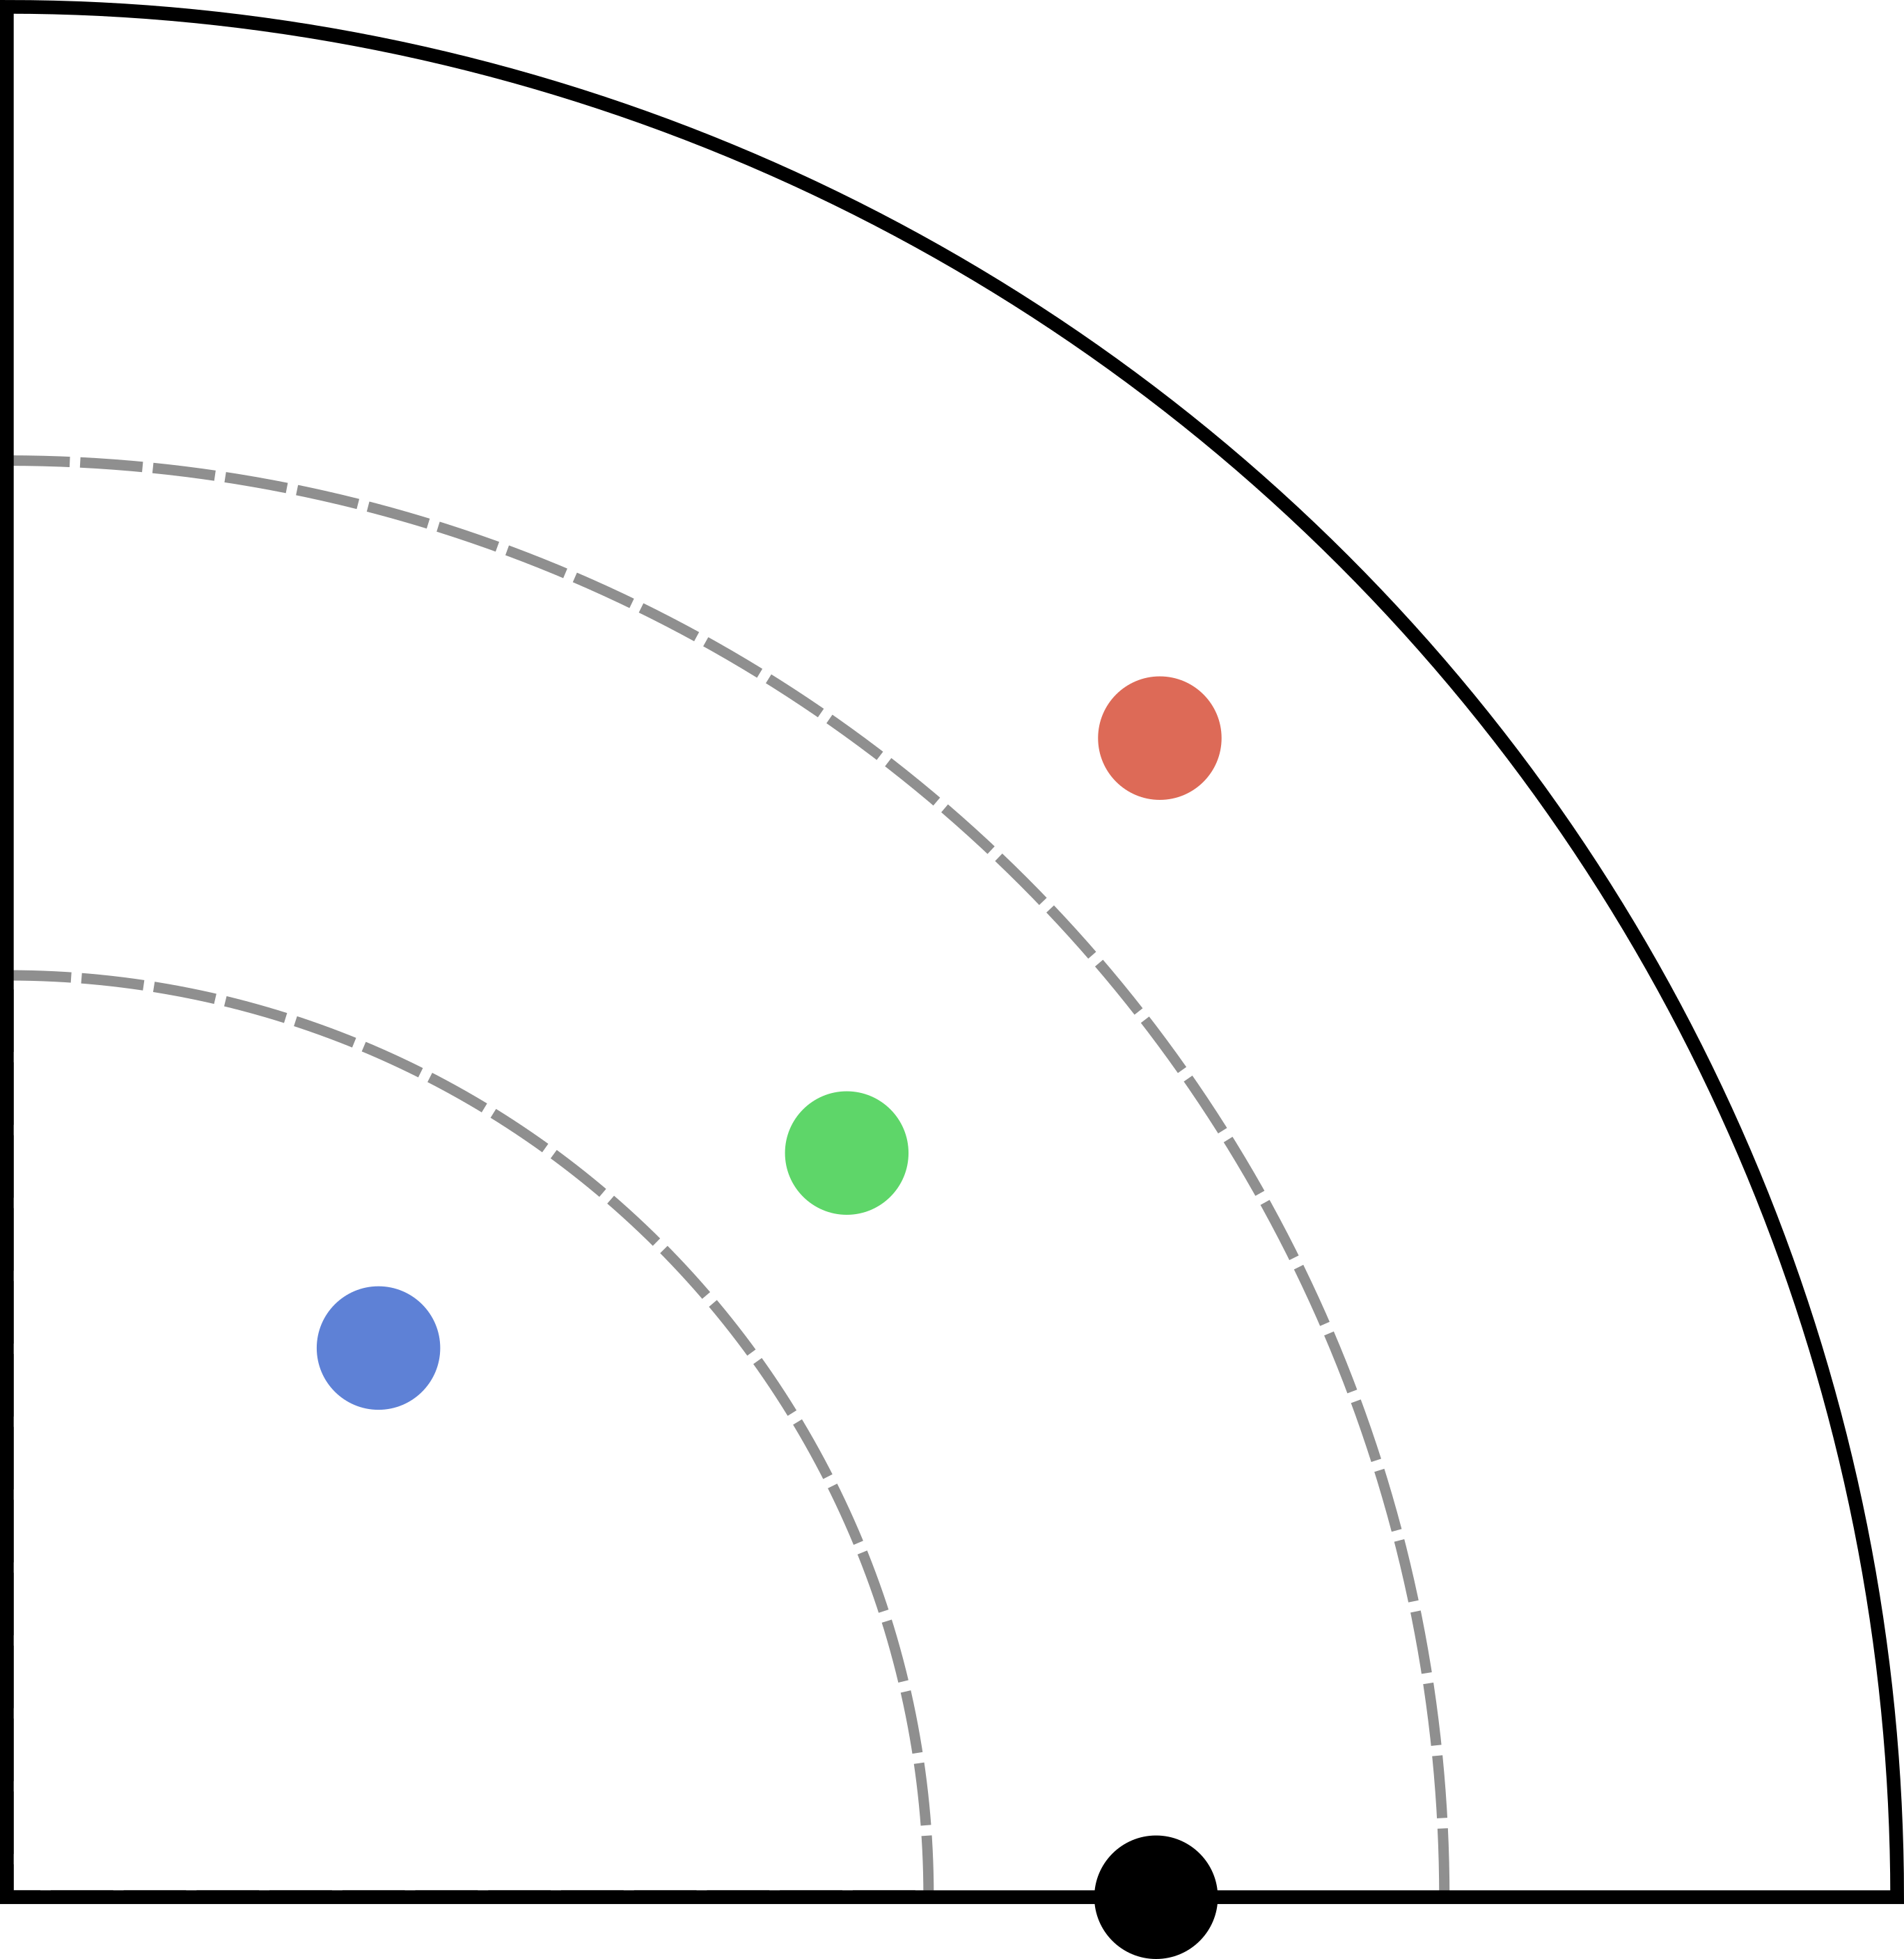
polar-diagrams is an open-source Python graphing library that creates interactive, publication-quality polar diagrams for model comparison. The library enables the evaluation of complex models across various domains, including biology, medicine, climatology, and machine learning. It addresses the challenge of evaluating models using multiple metrics by providing an integrated visualization approach. GitHub repository.
MOVIS is a multimodal omics application that enables the import, embedding, clustering, and interactive visualization of different types of omics data with temporal information. It provides insight into patterns and anomalies in an integrated environment, complementing traditional data exploration approaches. GitHub repository.
CMANGOES is an open-source CLI tool that can be used for encoding organic molecules into a machine-readable format. The tool facilitates the encoding of molecular data in both numerical and image formats, enabling users to analyze these encodings effectively. Its innovative interpretability feature empowers users to easily recognize patterns and uncover recurring signals within the encoded data. GitHub repository.
A short introduction to Data Exploration and Visualization is a comprehensive Jupyter notebook specifically crafted to familiarize students at the University of Marburg with the fundamental principles of Data and Information Visualization. This interactive resource serves as an essential component of the Data Visualization course, providing hands-on learning experiences and practical insights into the world of visualizing data. GitHub repository.
Determining protein N-glycosylation with machine learning methods is a Jupyter notebook created and submitted in partial fulfillment of the requirements for the degree of Master Mathematician at the University of Belgrade, Faculty of Mathematics. The notebook encompasses the practical aspects of the thesis, including data acquisition, analysis, preprocessing, machine learning model selection, hyperparameter tuning, and evaluation. GitHub repository.
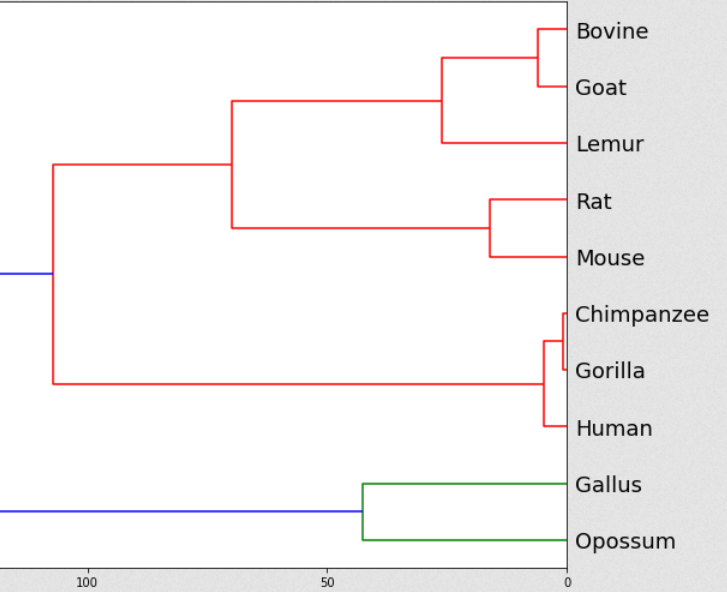
Modification and analysis of UPGMA algorithm while using different metrics is a project developed while attending the master’s course Introduction to Bioinformatics at the University of Belgrade, Faculty of Mathematics. This project focuses on exploring the utilization of diverse metrics for constructing phylogenetic trees through the UPGMA algorithm. The outcomes are effectively documented in a Jupyter notebook, encompassing data acquisition, analysis, preprocessing, algorithmic analysis, and evaluation of the generated dendrograms. GitHub repository.
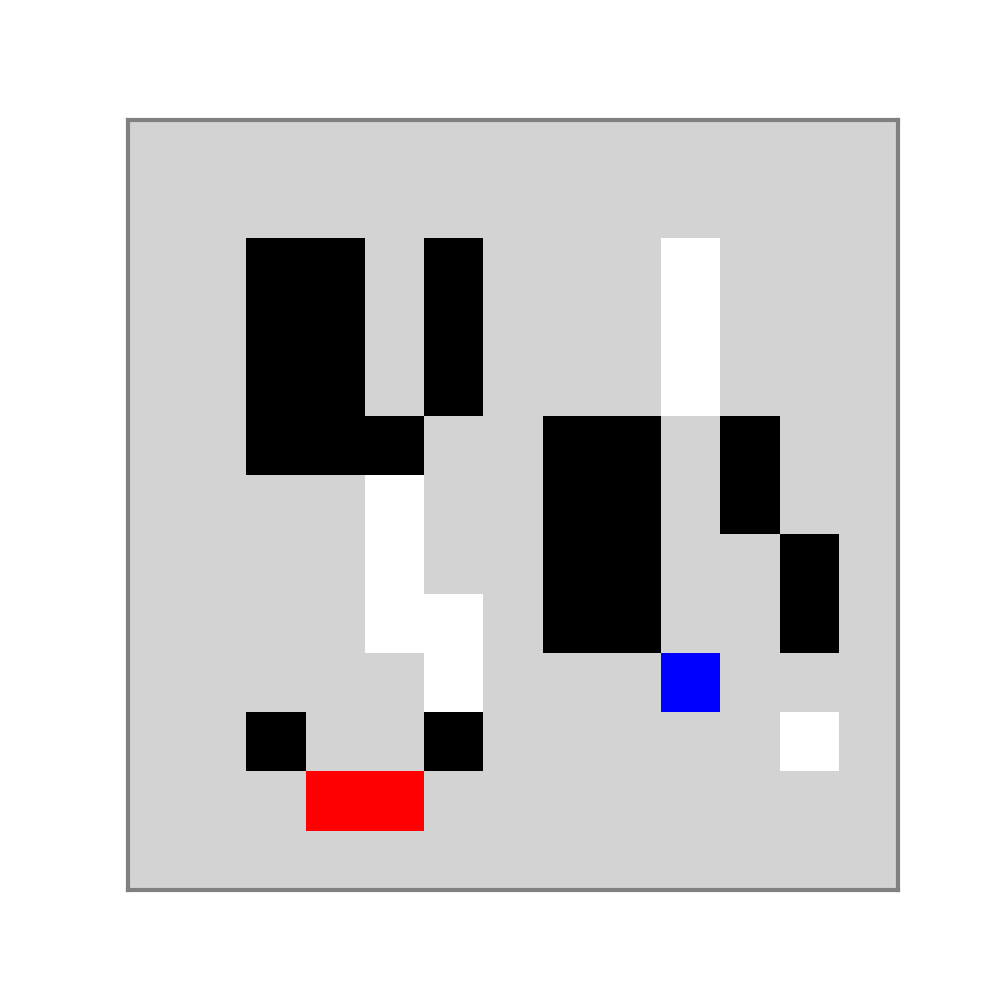
Finding Waldo using various Machine Learning methods is a project developed while attending the master’s course Machine Learning at the University of Belgrade, Faculty of Mathematics. This project investigates the application of diverse image preprocessing techniques and machine learning models to solve the challenge of locating Waldo. The outcomes of this project are detailed in a Jupyter notebook, encompassing data acquisition, analysis, preprocessing, machine learning model selection, hyperparameter tuning, and evaluation processes. GitHub repository.
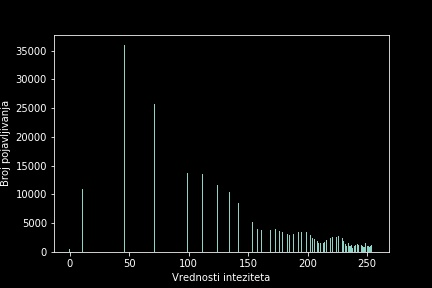
Image modification and correction in Python is a project developed while attending the master’s course Scientific Computing at the University of Belgrade, Faculty of Mathematics. This project delves into the exploration of various image processing techniques, including smoothing, edge detection, and histogram equalization. The outcomes of the project are documented in a Jupyter notebook, encompassing implementation, analysis, and evaluation of different image processing techniques. GitHub repository.
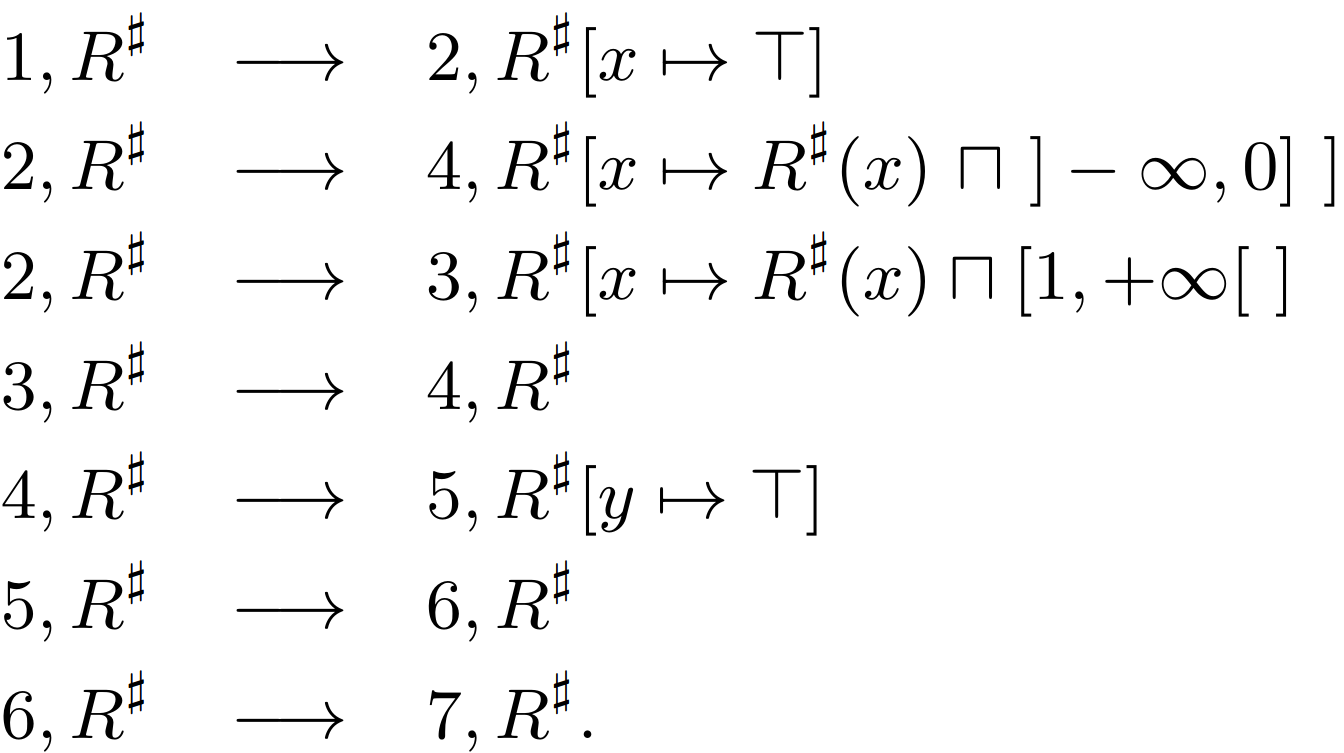
Determining integer variable ranges using Abstract Interpretation in C++ (LLVM, Clang) is a project developed while attending the master’s course Software Verification and Validation at the University of Belgrade, Faculty of Mathematics. The project explores the application of abstract interpretation, one of the prevalent static analysis methods, to verify the correctness of software written in C++. Specifically, it focuses on analyzing basic arithmetic operations. The outcomes of this project are presented in multiple C++ files, showcasing the implementation and application of abstract interpretation. GitHub repository.
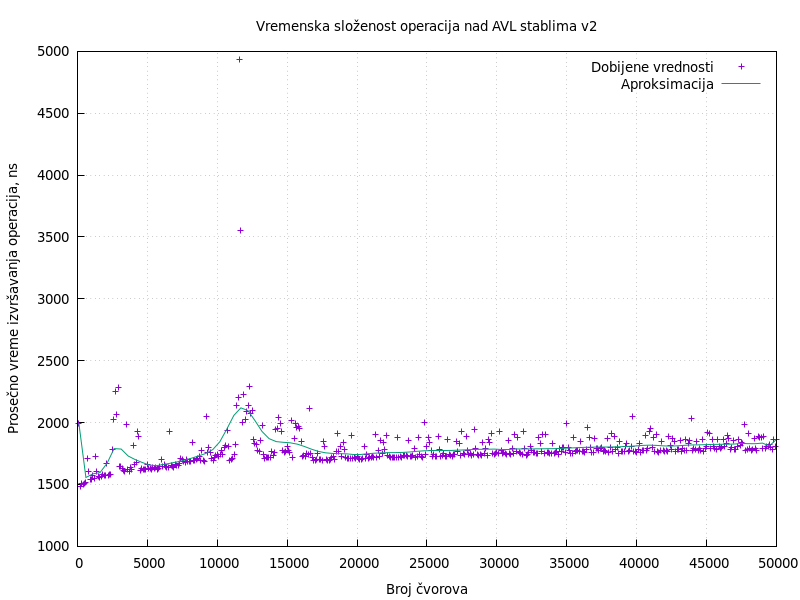
AVL trees in C programming language is a project developed while attending the master’s course Algorithm Analysis and Construction at the University of Belgrade, Faculty of Mathematics. The project focuses on the implementation and evaluation of AVL trees in the C programming language. The implementation incorporates the necessary rebalancing techniques to ensure optimal time complexity of O(log(n)) for common tasks such as lookup, insertion, and deletion of tree nodes. GitHub repository.


