
A multi-technique approach for improving summary polar diagrams
@article{anzel2026multitechniqueapproachimprovingsummary,
author={An{\v{z}}el, Aleksandar
and Yang, Zewen
and Hattab, Georges},
title={A multi-technique approach for improving summary polar diagrams},
journal={iScience},
year={2026},
month={Sep},
day={18},
publisher={Elsevier},
volume={29},
number={9},
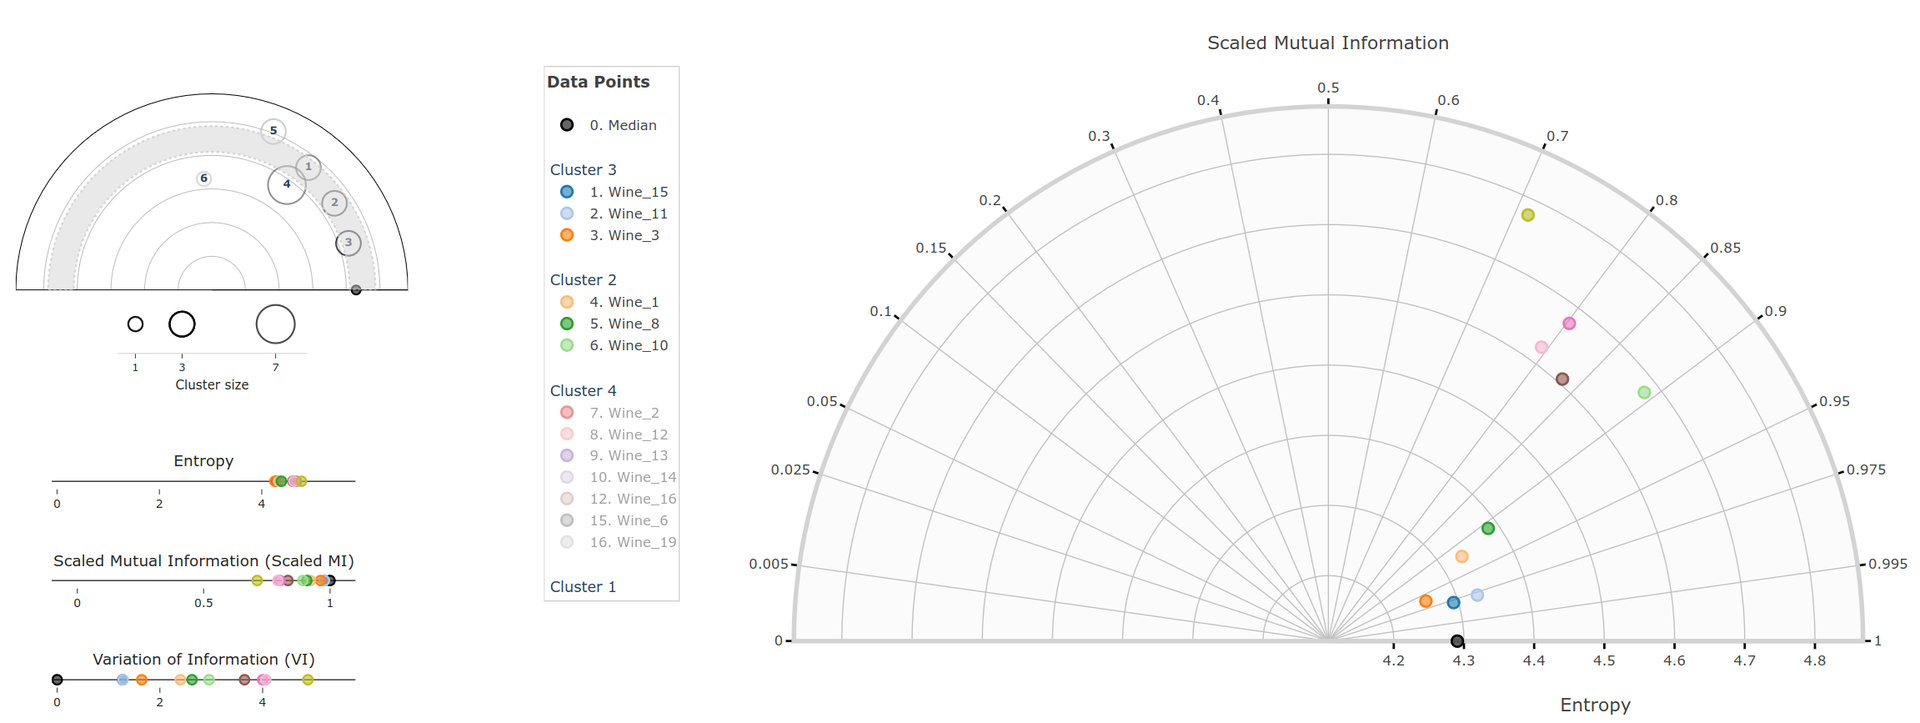
abstract={While the polar system may lack the universal familiarity of its Cartesian counterpart, it remains indispensable for certain tasks. Summary polar diagrams, such as Taylor and mutual information diagrams, address tasks like discovering relationships, visualizing data similarity, and quantifying correspondence. Although useful for revealing data relationships, these diagrams can be less intuitive and prone to issues like overplotting. We present a hybrid approach that combines overview+detail, aggregation, interactive filtering, Cartesian linking, and small multiples for summary polar diagrams. We performed a user study to assess the approach, and observed comparable response times among participants. In addition, three domain experts with varying levels of visualization experience reviewed the implemented solution, which applied summary polar diagrams across multiple application domains. Their feedback was essential for refining the design before the user study. The findings demonstrate the approach?s versatility across these application areas and its effectiveness in supporting comprehension, accessibility, and utility.},
issn={2589-0042},
doi={10.1016/j.isci.2026.117044},
url={https://doi.org/10.1016/j.isci.2026.117044}
}
While the polar system may lack the universal familiarity of its Cartesian counterpart, it remains indispensable for certain tasks. Summary polar diagrams, such as Taylor and mutual information diagrams, address tasks like discovering relationships, visualizing data similarity, and quantifying correspondence. Although useful for revealing data relationships, these diagrams can be less intuitive and prone to issues like overplotting. We present a hybrid approach that combines overview+detail, aggregation, interactive filtering, Cartesian linking, and small multiples for summary polar diagrams. We performed a user study to assess the approach, and observed comparable response times among participants. In addition, three domain experts with varying levels of visualization experience reviewed the implemented solution, which applied summary polar diagrams across multiple application domains. Their feedback was essential for refining the design before the user study. The findings demonstrate the approach’s versatility across these application areas and its effectiveness in supporting comprehension, accessibility, and utility.